
Core Idea
- Difficulty
- Medium
- Read it if
- You design, create, or consume any form of data visualization and want to improve clarity, precision, and analytical power in graphical displays. Essential for anyone in data science, journalism, research, or business intelligence.
- Skip it if
- You are looking for a practical, step-by-step software tutorial on how to create specific charts, or if your interest is solely in highly artistic or abstract data representations where analytical precision is secondary.
Key Takeaways from The Visual Display of Quantitative Information
Maximize Data-Ink, Minimize Chartjunk
Every drop of ink on a graphic should convey data, not decoration.
Tufte's main idea is the 'data-ink ratio,' which measures how much ink in a graphic shows data versus non-data elements. The goal is to maximize this ratio by removing 'chartjunk' – unnecessary or repeated graphic parts that distract from the data. This includes thick grid lines, too much decoration, misleading 3D effects, and repeated legends when labels work. By removing these extra parts, the data stands out more, leading to clearer and faster understanding. This idea is not about being plain, but about clarity and honesty, making sure the visual representation helps people understand the data.
“Above all else show the data.”
In the book: Tufte frequently shows 'before and after' examples, demonstrating how removing decorative borders, redundant axes, or heavy backgrounds dramatically improves the legibility and impact of the underlying data.
Try this: Review your own charts and graphs with a critical eye. For every line, shade, or color, ask: 'Does this directly represent data or aid in its understanding?' If not, remove it. Opt for subtle grid lines, direct labeling, and avoid gratuitous visual effects.
Related ideas: data-ink-ratio, chartjunk, data-visualization-principles
Small Multiples for Comparative Analysis
Repeated, identical graphics change only by data, facilitating powerful comparisons.
Small multiples, also called 'trellis displays,' are a good way to show data with multiple variables. They involve showing a series of small, identical graphics, each presenting a different part of the data (e.g., different time periods, categories, or regions). Because the design is consistent across all multiples, viewers can quickly see patterns, trends, and unusual points by comparing how the data changes visually, instead of trying to understand different chart types or complex legends. This method uses our ability to spot shifts and differences quickly, making complex comparisons clear and effective.
“Small multiples are 'micro/macro readings' where the overall structure of the graphic is seen at a glance and then, in another moment, details of the data are explored.”
In the book: Tufte showcases numerous historical examples, such as Minard's map of Napoleon's Russian campaign (which, while not strictly small multiples, demonstrates the power of rich, layered data) and various scientific charts comparing data across different experimental conditions using consistent visual frameworks.
Try this: When comparing data across multiple categories, time periods, or conditions, resist the urge to cram everything into one complex chart. Instead, create a grid of smaller, simpler charts, each illustrating a specific slice of the data, maintaining consistent scales and axes across all. This makes trends and outliers immediately apparent.
Related ideas: small-multiples, trellis-display, multivariate-data
The Power of High-Resolution Data
Dense, detailed graphics reveal more, not less, when designed thoughtfully.
Unlike the idea that 'less is more' in all design, Tufte argues for the power of detailed data displays. He supports graphics that show a lot of information, allowing viewers to see both general patterns and specific details at the same time. This needs careful design to avoid clutter, often done through methods like small multiples, layering, and precise labeling. The aim is to respect the viewer's intelligence and ability to process visuals, giving them enough context and detail to draw informed conclusions, rather than oversimplifying complex facts into easy but less informative summaries.
“Graphical excellence is that which gives to the viewer the greatest number of ideas in the shortest time with the least ink in the smallest space.”
In the book: Tufte frequently references historical masterpieces like Minard's map of Napoleon's Russian Campaign, which masterfully combines multiple variables (troops, temperature, date, location) into a single, highly informative graphic without sacrificing clarity.
Try this: Don't shy away from presenting rich datasets. Instead of breaking complex information into many separate, simple charts, explore ways to integrate related variables into a single, coherent graphic using layering, varying line weights, or well-placed annotations. Ensure scales are consistent and labels are clear, allowing for both macro and micro readings.
Related ideas: data-density, information-richness, macro-micro-readings
Avoid Graphical Deception
Design choices must reflect data variation, not distort it for manipulative ends.
Tufte carefully critiques graphics that mislead, often by accident, but sometimes on purpose. Graphical deception happens when the visual representation distorts the data, making differences seem larger or smaller than they are. Common examples include cut-off axes that exaggerate changes, inconsistent scales across comparison charts, using area or volume to show one-dimensional data (e.g., changing a bar's height and width when only height shows the value), and 'design variation greater than data variation.' Tufte stresses that ethical data visualization requires honesty and openness, where the visual form accurately shows the numerical reality.
“The greatest density of information, the best display of data, the most elegant and efficient design, is often the most truthful.”
In the book: Tufte dedicates a significant section to 'Graphical Deception: Design Variation vs. Data Variation,' showcasing numerous examples from newspapers and government reports where manipulated scales or misleading visual metaphors distorted public understanding of economic or social trends.
Try this: Always ensure your visual representations accurately reflect the magnitude of the data. Use full baselines for bar charts unless clearly indicated, maintain consistent scales across comparable graphics, and avoid using 3D effects or non-proportional scaling that can distort perception. Scrutinize published graphics for potential deceptive practices.
Related ideas: graphical-deception, data-integrity, misleading-graphics
Integrate Text and Graphics
Words and images should be interwoven, not separated, for cohesive understanding.
Traditional publishing often separates text, charts, and tables, making readers jump between different parts of a page or document. Tufte argues for closely combining text and graphics, placing labels, explanations, and notes directly on or next to the data they describe. This 'narrative flow' reduces mental effort, helping viewers understand information more naturally and quickly without looking for matching legends or text. This approach recognizes that reading a graphic is an active mental process, and design should help, not hinder, that process.
“Words, numbers, and drawing are not kept separate because the information is not kept separate in our minds.”
In the book: Tufte praises historical maps and scientific drawings (e.g., early anatomical illustrations) that seamlessly weave labels and descriptive text directly into the visual representation, enhancing immediate comprehension.
Try this: Whenever possible, directly label data points, lines, and regions on your charts instead of relying solely on a separate legend. Use annotations within the graphic to highlight key trends or outliers. Think of your graphic as a complete visual statement that can largely stand on its own, with supporting text integrated rather than externalized.
Related ideas: graphic-text-integration, direct-labeling, cognitive-load
Embrace Data Maps for Geographic Insights
Geographic context enriches data, revealing spatial patterns and relationships.
Tufte supports using data maps to show quantitative information in a spatial context. He shows how mapping data can reveal patterns, connections, and unusual points that might not be visible in other displays. A good data map combines accurate geographic representation with clear, well-chosen data overlays (e.g., color gradients, proportional symbols, flow lines). He emphasizes avoiding 'map junk' and ensuring the geographic base acts as a transparent frame for the data, not a distraction. The relationship between location and data points often leads to important insights.
“Data maps, like all good information displays, are a combination of art and science, clarity and complexity.”
In the book: Tufte features John Snow's cholera map, a seminal example of using geographic data to identify the source of a disease outbreak, demonstrating the profound impact of spatial visualization.
Try this: When your data has a geographic component, strongly consider mapping it. Choose appropriate visual variables (color, size, texture) to represent your data on the map. Ensure the base map is minimal and serves only to provide context, allowing the data itself to be the focal point. Look for spatial clusters or outliers that might reveal new insights.
Related ideas: data-maps, geographic-visualization, spatial-analysis
Aesthetics Serve Function
Beauty in data visualization arises from clarity, precision, and intellectual honesty.
For Tufte, aesthetics in data visualization are not about superficial decoration but about the beauty of clear, precise, and honest representation. A 'beautiful' graphic communicates complex information well, with elegance and efficiency, making the data accessible and understandable without distortion. This often means using subtle colors, thin lines, and good typography that blends into the background, letting the data stand out. True graphical excellence is found when form follows function, and the visual design improves, rather than detracts from, the data's message.
“The best graphics are about the careful and precise rendering of information, not about decoration.”
In the book: Tufte showcases numerous historical and contemporary examples of 'graphical excellence,' such as William Playfair's early statistical charts, which, despite their age, possess an enduring clarity and elegance due to their functional design.
Try this: Prioritize clarity and precision over flashy design elements. Use subtle, harmonious color schemes that differentiate data without overwhelming it. Choose legible fonts and appropriate line weights. Focus on making the data easy to read and interpret, and the aesthetic appeal will naturally follow from its effectiveness.
Related ideas: graphical-excellence, data-aesthetics, functional-design
The Importance of Comparison
Data is most meaningful when viewed in relation to other data.
A key part of good data visualization is making comparisons easy. Isolated data points or trends mean less than when they are shown with other relevant information. Tufte supports designs that let viewers easily compare different variables, time periods, categories, or groups. This can be done through consistent scaling, layering multiple datasets on the same graphic, or, most effectively, through small multiples. The human eye is good at finding differences and similarities when data is presented for comparison, leading to deeper insights and stronger conclusions.
“Comparison is the key to understanding, and data graphics are often the best way to make comparisons.”
In the book: Tufte frequently demonstrates how juxtaposing different datasets on a single graphic (e.g., showing unemployment rates alongside inflation) or using small multiples for different regions allows for more profound analytical insights than viewing each dataset in isolation.
Try this: When designing a graphic, always ask: 'What am I trying to compare?' Then, design your chart to make that comparison as easy and direct as possible. Use consistent axes, clear legends (if necessary), and consider visual techniques like sparklines or small multiples to place data in a comparative context.
Related ideas: comparative-analysis, data-comparison, contextual-data
Avoid Data-Ink Swindles
Be wary of graphics that inflate data-ink without increasing information.
A 'data-ink swindle' happens when a graphic uses a lot of ink to show very little information, essentially weakening the data's impact. This is often seen in overly simple charts that show only a few data points within a large, empty visual space, or in pie charts with only two slices that could be more simply stated as a single number. While a simple chart is sometimes appropriate, a swindle occurs when the visual design exaggerates the importance or complexity of minor data, wasting the viewer's time and attention. The goal is efficiency: maximum information shown with minimum visual clutter.
“The principle of the data-ink ratio means that for every bit of data-ink, there should be a corresponding bit of data.”
In the book: Tufte criticizes common corporate report graphics that feature oversized, heavily bordered charts displaying only two or three data points, often with redundant labels and excessive whitespace, demonstrating a low data-ink ratio without any corresponding increase in clarity.
Try this: Before creating a complex chart, consider if a simple table or even a sentence could convey the information more efficiently. If you must use a graphic, ensure it is densely packed with relevant data, avoiding large empty spaces or overly elaborate designs for minimal information. Every visual element should earn its place.
Related ideas: data-ink-swindle, information-efficiency, visual-economy
Edit and Refine Graphics Relentlessly
Good graphics are made, not born; they result from iterative improvement.
Tufte's work promotes a careful, ongoing process of editing and improving data graphics. Just as writers revise text, designers must constantly check their visualizations for clarity, precision, and efficiency. This means actively finding and removing chartjunk, improving the data-ink ratio, ensuring accurate representation, and enhancing the overall aesthetic and intellectual integrity of the display. The best graphics come from thoughtful revision, where every element is justified and contributes meaningfully to understanding the data. It is about moving from an initial idea to a polished, effective communication tool.
“Clutter and confusion are not attributes of data, they are shortcomings of design.”
In the book: The entire book is an exercise in critique and improvement, with Tufte dissecting various graphics, pointing out flaws, and suggesting concrete ways to enhance their effectiveness and truthfulness.
Try this: Treat your data graphics as living documents. After creating an initial draft, step away, then return with a critical eye. Ask colleagues for feedback. Systematically remove non-data ink, simplify legends, refine labels, and ensure scales are appropriate. Continuous improvement is key to achieving graphical excellence.
Related ideas: graphic-editing, design-iteration, visual-refinement
The Visual Display of Quantitative Information Quotes
“The greatest challenges in the design of statistical graphics are the challenges of understanding.”
“Above all else show the data.”
“Clutter and confusion are failures of design, not attributes of information.”
“Graphical excellence is that which gives to the viewer the greatest number of ideas in the shortest time with the least ink in the smallest space.”
“Data graphics are paragraphs about numbers, and, like well-written paragraphs, they should have a topic sentence, a verb, and a period.”
“What is to be sought in designs for the display of information is the clear portrayal of complexity, not the reduction of complexity to simplicity.”
“Chartjunk is that entire interior decoration of graphics that does not tell the viewer anything new.”
“The world is complex, dynamic, multidimensional; the paper is flat, static, two-dimensional. How are we to represent the rich visual world of experience and measurement on mere flatland?”
“Graphical displays should be of high resolution, revealing the data in detail.”
“To clarify, add detail.”
“The often-heard lament, 'I have too much information,' usually means 'I cannot organize the information to suit my purposes.'”
“Even the most sophisticated graphics are not panaceas; they are but one instrument in a larger orchestra of information.”
“Graphical excellence requires telling the truth about the data.”
“The principle of data-ink maximization means that nearly all ink should present data-information, not non-data-information.”
Quiz
10 questions on the main ideas. Each answer comes with a short explanation.
Question 1
Which of the following principles, introduced by Tufte, emphasizes maximizing the proportion of ink used to display data rather than non-data elements?
- Chartjunk minimization
- Data-ink ratio
- Lie factor reduction
- Small multiples design
Show answer
B. Data-ink ratio The data-ink ratio is a core concept from Tufte's book, advocating for the removal of non-essential ink to highlight the data itself. Chartjunk is a broader term for superfluous elements, but the data-ink ratio is the specific metric for this principle.
Question 2
According to Tufte, what is the primary purpose of 'small multiples' in data visualization?
- To create visually appealing dashboards with diverse chart types.
- To allow for easy comparison of different categories or conditions by repeating the same graphic structure.
- To reduce the overall size of a single large chart to fit more on a page.
- To enable interactive filtering and zooming within a digital display.
Show answer
B. To allow for easy comparison of different categories or conditions by repeating the same graphic structure. Small multiples are a powerful technique for displaying multivariate data by repeating a simple graphic structure for each of a series of variables or categories, facilitating comparison.
Question 3
Tufte emphasizes that graphical displays should primarily show:
- The aesthetic beauty of the design.
- The data.
- The designer's creativity.
- The complexity of the statistical model.
Show answer
B. The data. A central tenet of Tufte's philosophy is that graphical displays should above all else show the data, making it clear, precise, and effective for analysis.
Question 4
Which of the following is NOT considered 'chartjunk' by Tufte?
- Heavy grid lines that obscure data points.
- Decorative shading or patterns that do not encode data.
- Labels and annotations that precisely identify data points.
- 3D effects on bar charts that distort perception of magnitude.
Show answer
C. Labels and annotations that precisely identify data points. Chartjunk refers to superfluous elements that do not convey data. Labels and annotations, when precise and necessary, are essential data-carrying elements, not chartjunk.
Question 5
Tufte discusses 'graphical deception' by contrasting 'design variation' with 'data variation'. What does 'design variation' primarily refer to in this context?
- The legitimate use of different chart types to represent different kinds of data.
- Changes in the graphic's visual elements that do not correspond to changes in the underlying data.
- The use of color to differentiate distinct data series effectively.
- The natural spread or variability within the dataset being displayed.
Show answer
B. Changes in the graphic's visual elements that do not correspond to changes in the underlying data. Tufte warns against graphical deception where changes in the visual design (e.g., using a larger icon to represent a larger quantity) are not proportional to the actual data changes, thus misleading the viewer. This is 'design variation' not reflecting 'data variation'.
Question 6
When discussing the importance of high-resolution displays, Tufte advocates for graphics that are 'data rich'. What characteristic does a data-rich graphic possess according to Tufte?
- It uses many different colors and fonts to attract attention.
- It presents a large amount of information in a small space without clutter.
- It relies heavily on interactive elements for data exploration.
- It uses complex statistical models to derive insights.
Show answer
B. It presents a large amount of information in a small space without clutter. Tufte champions high-resolution, data-rich displays that maximize the amount of information conveyed per unit area, allowing for precise and detailed analysis without unnecessary clutter.
Question 7
The second edition of 'The Visual Display of Quantitative Information' specifically highlights improvements in the reproduction of which historical graphic designer's work?
- Charles Joseph Minard
- Florence Nightingale
- William Playfair
- John Snow
Show answer
C. William Playfair The description for the second edition explicitly states, 'this new edition provides excellent color reproductions of the many graphics of William Playfair, adds color to other images...'
Question 8
Tufte argues against using 'moiré effects' in data graphics. What is a moiré effect in this context, and why is it problematic?
- It's a subtle color gradient used to show continuous data, problematic because it can be hard to print accurately.
- It's a pattern of visual interference created by overlapping grids or lines, problematic because it distracts from the data.
- It's a technique for showing depth in 3D graphs, problematic because it often distorts perception of scale.
- It's an optical illusion causing stationary objects to appear to move, problematic because it causes eye strain.
Show answer
B. It's a pattern of visual interference created by overlapping grids or lines, problematic because it distracts from the data. Moiré effects are distracting visual vibrations or patterns caused by high-frequency grids or parallel lines. Tufte critiques them because they introduce noise and divert attention from the actual data pattern.
Question 9
Regarding multivariate designs, Tufte often advocates for which approach to displaying multiple variables simultaneously?
- Aggregating all variables into a single, complex 3D plot.
- Using a separate, distinct chart type for each variable to avoid confusion.
- Employing small multiples where the same graphic structure is repeated for different conditions or variables.
- Minimizing the number of variables displayed to maintain simplicity.
Show answer
C. Employing small multiples where the same graphic structure is repeated for different conditions or variables. For multivariate designs, Tufte frequently champions small multiples as an effective method to display many variables in a coherent and comparable manner, allowing viewers to see patterns and differences across multiple dimensions.
Question 10
Tufte's concept of 'lie factor' is calculated by the ratio of the size of the effect shown in the graphic to the size of the effect in the data. A lie factor significantly greater or less than 1 indicates:
- The graphic is aesthetically pleasing but lacks data density.
- The graphic is accurately representing the data's proportions.
- The graphic is distorting the true magnitude of the data's changes or differences.
- The graphic effectively uses color to highlight important trends.
Show answer
C. The graphic is distorting the true magnitude of the data's changes or differences. A lie factor of 1 means the graphic accurately represents the data. A lie factor significantly different from 1 (e.g., 2 or 0.5) indicates that the graphic is exaggerating or downplaying the actual changes in the data, thereby misleading the viewer.
The Visual Display of Quantitative Information FAQ
What is 'The Visual Display of Quantitative Information' about?
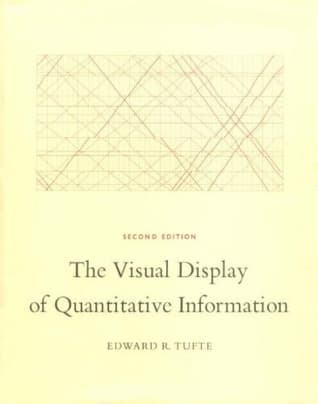
This book is a seminal work on statistical graphics, charts, and tables, focusing on the theory and practice of designing data displays. It teaches readers how to present quantitative information precisely, effectively, and for quick analysis, using over 250 illustrations to demonstrate best practices and common pitfalls.
What is the 'data-ink ratio' concept introduced by Edward Tufte?
The data-ink ratio is a core principle suggesting that a large proportion of the ink used in a graphic should be devoted to displaying data-information, rather than non-data-ink or redundant elements. The goal is to maximize the amount of data presented while minimizing visual clutter, thereby improving clarity and impact.
Does applying Tufte's principles work for modern digital dashboards and data visualization tools?
Yes, Tufte's principles are highly applicable to modern digital dashboards and data visualization tools, advocating for clarity, precision, and efficiency in information display. While the medium has changed, the underlying goals of effective data communication remain the same, making his insights timeless for any visual data presentation.
How does this book differ from other data visualization books that focus on specific software or programming languages?
Unlike books focused on specific software or programming languages, Tufte's work provides foundational, medium-agnostic principles for effective data visualization. It delves into the cognitive and aesthetic aspects of design, offering timeless guidance that transcends particular tools or technologies and can be applied universally.
What are 'small multiples' and why are they important in data visualization?
Small multiples are a series of graphics that use the same design and scale to display different subsets of a dataset, allowing for easy comparison across categories or time. They are important because they enable viewers to grasp complex multivariate data quickly and effectively by leveraging visual consistency.
Does the book provide examples of bad data visualizations?
Yes, the book includes examples of both exemplary and poorly designed statistical graphics, offering detailed analyses of each. By examining common errors and sources of graphical deception, Tufte teaches readers how to identify and avoid designs that mislead or obscure data.
Is 'The Visual Display of Quantitative Information' suitable for beginners in data visualization?
While comprehensive, the book is highly beneficial for beginners as it lays a strong theoretical and practical foundation for understanding effective data visualization. Its principles are clearly explained and illustrated, making complex ideas accessible to those new to the field, though some concepts may require careful study.
What is graphical deception and how does the book help detect it?
Graphical deception refers to the manipulation of visual elements in a chart to distort or misrepresent data, often by confusing design variation with data variation. The book provides tools and analytical frameworks to detect such deception, teaching readers to critically evaluate graphics for integrity and accuracy.
About the author
Edward R. Tufte is an expert in data visualization and statistics, known for his influential work in the field of information design. His book, The Visual Display of Quantitative Information, is a foundational text that explores the effective presentation of data through graphics. Tufte's contributions have significantly shaped the way information is communicated visually.
Similar books
- Steve Jobs
Walter Isaacson
4.1 (957k) average on GoodreadsBusinessSteve Jobs was a visionary who fused creativity and technology to revolutionize six industries and shape our digital world.
- Freakonomics: A Rogue Economist Explores the Hidden Side of Everything
Steven D. Levitt
4.0 (709k) average on GoodreadsBusinessThis book uses economic principles to reveal the surprising incentives behind everything from drug dealing and real estate to cheating teachers and the decline of crime.
- The Tipping Point: How Little Things Can Make a Big Difference
Malcolm Gladwell
4.0 (690k) average on GoodreadsBusinessMalcolm Gladwell explains how small, targeted actions can start widespread changes in trends, behaviors, and ideas.
- Outliers: The Story of Success
Malcolm Gladwell
4.2 (556k) average on GoodreadsBusinessMalcolm Gladwell argues that true success is not just about individual talent, but about the hidden advantages of culture, opportunity, and unique experiences that shape extraordinary lives.
- The Subtle Art of Not Giving a F*ck: A Counterintuitive Approach to Living a Good Life
Mark Manson
3.9 (530k) average on GoodreadsBusinessEmbrace your flaws and stomach life's lemons, because true happiness isn't about relentless positivity, but about choosing what truly matters to give a f*ck about.
- The 7 Habits of Highly Effective People: Powerful Lessons in Personal Change
Stephen R. Covey
4.1 (524k) average on GoodreadsBusinessThis book presents seven habits that help people live more effective, purposeful lives.





Enjoyed the summary?
A summary gives you the shape of the book. The book itself has the detail, the examples and the voice.
Find The Visual Display of Quantitative Information on AmazonAs an Amazon Associate, BookBrief earns from qualifying purchases. How we're funded